A Scorecard for Police Departments
Here’s a new way to help people evaluate the performance of the law-enforcement agencies that patrol their communities.
As the Black Lives Matter movement rose to national prominence in 2015, a small group associated with the push to end unnecessary police killings suggested 10 specific reforms that every police agency ought to adopt, hoping to inspire informed, constructive activism in communities across the country.
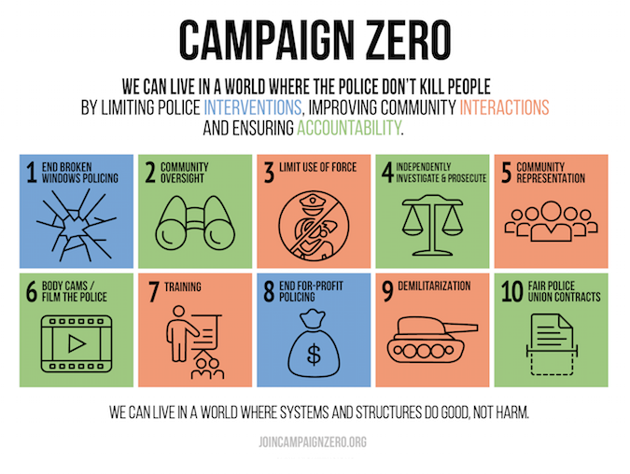
On Wednesday, Campaign Zero launched a new initiative grounded in a similar premise—that changing outcomes in a country with 18,000 law-enforcement agencies requires local reform efforts “in every jurisdiction,” and that people everywhere therefore need enough information “to effectively evaluate each law enforcement agency and hold them accountable to measurable results.”
But how to achieve that?
Campaign Zero’s provisional answer is Police Scorecard, a new site that assigns grades to 100 large police departments in California. The organization chose that state because it collects and publishes more data on police agencies than most others.
Perhaps most striking in the statewide analysis: “Overall, half of people killed or seriously injured by police (49%) were unarmed.” And the deadliest locales:
Police in San Bernardino, Riverside, Stockton, Long Beach, Fremont and Bakersfield used deadly force at substantially higher rates than other major cities in California. San Jose and Los Angeles police used deadly force at 3x the rate of police in San Francisco and San Diego. And Oakland police had one of the lowest rates of deadly force, reflecting the substantial decline in use of force incidents that has followed DOJ mandated reforms to their use of force policies.
Carlsbad, a sleepy seaside municipality in North San Diego County, enjoyed the best-performing police department among those graded, while ultra-wealthy Beverly Hills performed the worst, according to analysis of data from 2016 and 2017.
In Oakland, 12,142 arrests were made in 2016.
Over two years, San Francisco had 778 civilian complaints of police misconduct. But just one in 13 was decided in favor of the civilian.
Costa Mesa, the municipality of 114,000 where I grew up, got a D+, even though it was one of only 15 police agencies included in the study that did not use deadly force in the period under consideration, in part because “police made 10.6x as many arrests for low level offenses as for violent crimes in 2016.”
Los Angeles got an F. In 2016 and 2017, there were reportedly 131 deadly force incidents, only one in every 24 complaints resulted in rulings favoring civilians, and police made 5.4x as many arrests for low-level offenses as for violent crimes.
At this early date, read Police Scorecard with caution.
As with efforts to evaluate colleges and rank them from top to bottom, the metrics are inevitably imperfect, and the outcomes are contestable. Police Scorecard omits some major policing agencies that contract with municipalities, like the Los Angeles County Sheriff’s Department and its 9,400 deputies.
It is nevertheless a useful and constructive effort––as a blueprint for what could be built in other states, a resource for Californians wanting to learn more about local policing, and a launchpad for discussion among activists, wonks, journalists, elected officials, and others who can help refine its methodology.
If you live outside of California, urge your state to create something like the California Department of Justice’s OpenJustice database. When data are available, projects like this one can follow. If you have a specific suggestion for improvement, email me.